Estate Basin – Sunny Day and Multiple Flood Failure Assessments
As part of an estate development project, an above ground basin was proposed to mitigate increases in runoff. While a relatively minor storage (~ 5 ML to the spillway), proximity to a road and private properties posed potential failure risks. The following events were assessed as part of this assessment to quantify these risks:
· Sunny Day Failure (SDF)
· 1 in 5 year (20% AEP) flood failure (FFS)
· 1 in 20 year (5% AEP) FFS
· 1 in 100 year (1% AEP) FFS
· Probably maximum flood (PMF) FFS
Due to complexities of the hydrodynamic model provided (rain on grid plus various fixed inflow locations) and the basin having a large surface area relative to storage volume, an alternative approach to modelling the basin in Breacher with inflows was required. Basin outflow hydrographs and peak elevations were extracted from the hydrodynamic model for each of the events described above.
The basin was then simulated in Breacher as an SDF failure model for all events (even the FFS events) with fixed water levels matching the peak elevations extracted from the hydrodynamic model. If the outflow hydrographs were included in Breacher as inflows, this would cause a “double counting” of basin attenuation effects.
A comprehensive simulation was ran for all events in Breacher to estimate initial parameter ranges (example for SDF shown in Figure 31).


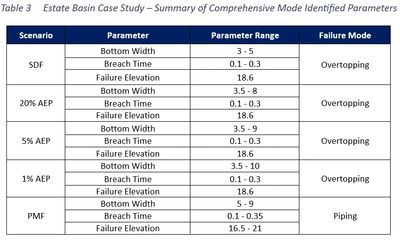
The parameter ranges identified in the comprehensive simulation are summarised in Table 3. Decision making was made around failure mode, with overtopping of the spillway found to be critical for most of the events, and piping of the embankment found to be critical for the PMF.

The simulated PMF runs were imported into Breacher-Post to identify the critical piping elevation, the resulting plot is shown in Figure 32 and binned elevation plot from Breacher-Post in Figure 33.

The breach time and bottom width relative to peak flow is shown in Figure 34.
A weir and orifice coefficient of discharge of 1.45 and 0.3 was identified as suitable for all simulated events, this was following additional simulations and analysis.
Results from all the breach scenarios are summarised below, with the updated peak flows (once reinforced with the original outflow hydrographs) included.
- Sunny Day Failure (SDF):
- Breach time: 0.2 hrs
- Breach width: 4.25 m
- Breach peak flow: 7.5 m3/s
- Literature peak flow range: 4.6 – 12 m3/s
- 1 in 5 year (20% AEP) flood failure (FFS):
- Breach time: 0.22 hrs
- Breach width: 6.2 m
- Breach peak flow: 24.62 m3/s
- Literature peak flow range: 13 – 30 m3/s
- Combined (breach + release) peak flow: 46.6 m3/s
- 1 in 20 year (5% AEP) FFS
- Breach time: 0.25 hrs
- Breach width: 7 m
- Breach peak flow: 28.55 m3/s
- Literature peak flow range: 14 – 33 m3/s
- Combined (breach + release) peak flow: 46.6 m3/s
- 1 in 100 year (1% AEP) FFS
- Breach time: 0.275 hrs
- Breach width: 7.6 m
- Breach peak flow: 32.16 m3/s
- Literature peak flow range: m3/s
- Combined (breach + release) peak flow: 72.4 m3/s
- Probably maximum flood (PMF) FFS
- Breach time: 0.22 hrs
- Breach width: 6.7 m
- Breach peak flow: 71.68 m3/s
- Literature peak flow range: 35 – 96 m3/s
- Combined (breach + release) peak flow: 204.1 m3/s

An example of the combined (breach + release) flow hydrograph, for the PMF, is shown in Figure 35.
As the Breacher peak flow for each event correlated with peak flows from the literature for all events when utilising parameters (breach bottom width and breach time), it became evident that the results are both reasonable and feasible.
This correlation demonstrates that, by accurately modeling these parameters, one can achieve realistic predictions of dam break scenarios.
RESOURCES
Learn More About Breach Hydro
This website uses cookies.
We use cookies to analyse website traffic and optimize your website experience. By accepting our use of cookies, your data will be aggregated with all other user data.
