BREACH HYDRO - Water Balance Suite for Stochastic Dam Break
What is Breacher-Post?
Included in the suite is Breacher-Post, a windows-based application to allow for reviewing and performing analytics on Breacher results. Ultimately this is to help the user with decision making around suitable parameters and uncertainties / confidence ranges.
Five (5) methods for cutting the data from the summary.bsf have been included in Breacher-Post.
To import the data, just click “Import BSF file” and select the summary file.
Once the chart required has been toggled on (ticked) and variables and inputs allocated, click “Generate files” to generate the chosen charts.

Detailed Plots

Detailed plot has been provided as a quick method for checking the simulated runs when Breach_Output = "Detailed" is triggered in Breacher. Detailed Plot reads the summary.bsf file and loads all csv runs that are listed in the file. Example shown in Figure 13.
Distribution Plots
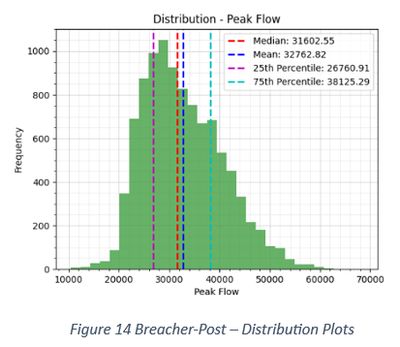
Distribution plots have been provided as a quick method for checking peak flow variation and for the user to check if parameter randomisation (ie breach bottom width) has been performed correctly.

Exceedance Plots

Exceedance plots are useful tools for estimating critical parameters where relationships to peak flow aren’t directly correlated. For example, many guidelines in Australia suggest choosing a failure elevation that produces the highest peak flow, using exceedance plots at elevation increments allows identifying the failure elevation that has a higher peak flow magnitude to others.
Figure 15 shows the dam being assessed has a critical failure elevation between RL 276 to 277.
Binned Data
Similarly to exceedance plots, binning data is a useful tool for estimating critical parameters where relationships to peak flow aren’t directly correlated. Shown in Figure 16, binning failure elevation also suggests a critical failure elevation between RL 276 to 277.
Binning can also be applied to coefficients to check their relationship to peak flow, shown in Figure 17orifice coefficient of discharge seems to have negligible impact on peak flow.

Scatter Plot

Colour coded (by peak flow) scatter plot has been included as an optional chart in Breacher-Post. It’s use hasn’t been explored in detail yet but there’s potential use for visualising relationships, identifying clusters and enhancing the modellers interpretability of results
This website uses cookies.
We use cookies to analyse website traffic and optimize your website experience. By accepting our use of cookies, your data will be aggregated with all other user data.
